2nd Peak and Early Detection
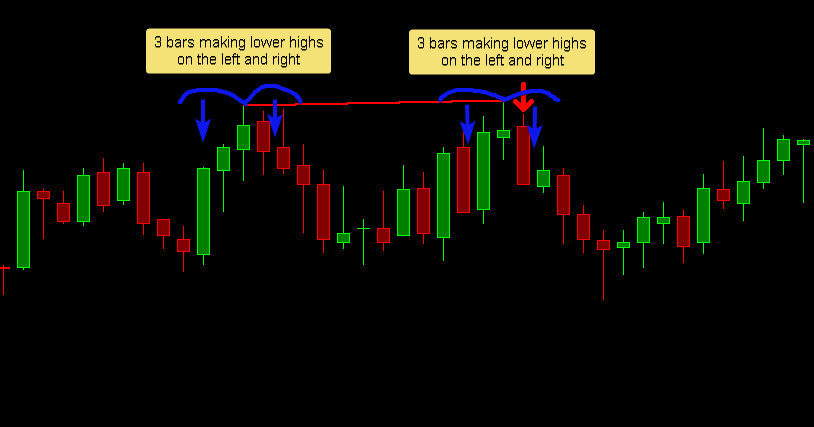
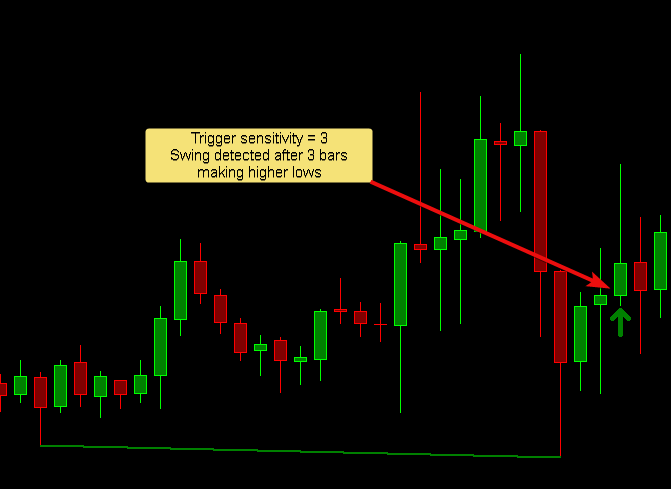
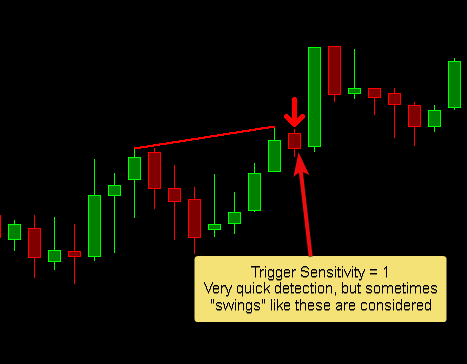
The 2nd peak actually has 2 sensitivity values: 2nd peak left and 2nd peak right. The reason for that is to allow for a mix of detecting peaks that have advanced enough in one direction but to get an early alert without having to wait for the full pattern to form (see the images below for an example.
Early Detection
| Anchor | ||||
|---|---|---|---|---|
|
The Trigger Sensitivity input controls the 2nd peak's right side sensitivity and by extension how quickly a peak is detected. Lower values means sooner detection of divergence, but more false positives on short swings.
Divergence Lookback
| Anchor | ||||
|---|---|---|---|---|
|
Divergence is detected between two swings. The study is limited in how many peaks it can look back through for divergence through the Divergence Lookback Number of Peaks input. If there are multiple peaks that divert in the lookback it selects one according to the Divergence Lookback Use Nearest/Furthest Peak input.
Filters
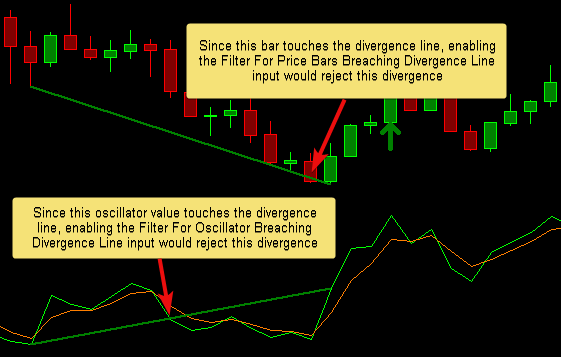
Bars/Oscillator Crossing Divergence Line
| Anchor | ||||
|---|---|---|---|---|
|
Inputs
| Input name | Description |
|---|---|
| Bullish Divergence Price Reference | Reference to the input data for detecting Swing Lows |
| Bearish Divergence Price Reference | Reference to the input data for detecting Swing Highs |
| Oscillator Reference | Reference to the subgraph we want to detect divergence with |
| Draw Divergence Lines |
| Select whether to draw the actual divergence lines on the main price panel and/or the oscillator region | |
| Oscillator Graph Region | The graph region of the oscillator |
| Swing Sensitivity |
| Number of bars sensitivity for |
| detecting swings (see |
| Sensitivity Settings) |
| Trigger Sensitivity |
| Number of bars sensitivity on the |
| right side of the |
| 2nd |
| peak (see Early Detection) |
| On Bar |
| close | Should the divergence be detected on bar close or intrabar |
Subgraphs
| Divergence Signal Visual Offset (in Ticks) | Visual offset in ticks from the bar of the arrow marking divergence detection |
| Divergence Types to Detect | Select whether Regular and/or Hidden Divergence types are detected |
| Oscillator Pivot Alignment Enabled | When enabled and a price swing is detected, the study will look back for a swing in the oscillator to use for divergence detection. If no swing is found then the study will not look for divergence. |
| Oscillator Pivot Alignment Lookback | Amount of bars to look back in the oscillator for a swing. |
| Bullish Divergence Line Color | Color for lines drawn for Bullish Divergence |
| Bearish Divergence Line Color | Color for lines drawn for Bearish Divergence |
| Divergence Line Width | Width of lines drawn for Divergence |
Filter For Price Bars Breaching Divergence Line | Select to filter out price bars that breach the divergence line either with their closing value or any value in-between high and low (see Bars/Oscillator Crossing Divergence Line) |
| Filter For Oscillator Breaching Divergence Line | Select to filter out oscillator values that breach the divergence line (see Bars/Oscillator Crossing Divergence Line) |
| Allow Divergence Line to Span Multiple Trading Sessions | Should divergences be allowed to span multiple trading sessions |
| Divergence Lookback Number of Peaks | Number of peaks to look through for divergence (see Divergence Lookback) |
| Divergence Lookback Use Nearest/Furthest Peak | Select whether to prefer the furthest or nearest diverting peak found in the lookback |
| Divergence Line Slope Filter Minimum Price Difference Units | Select whether to use difference in points or percentage when filtering out divergences that are too small |
| Divergence Line Slope Filter Minimum Price Difference | Minimum difference between two peaks to be considered for divergence |
| Divergence Line Filter Minimum Oscillator Difference | Minimum difference in points between two oscillator values to be considered for divergence |
Subgraphs
| Subgraph | Description |
|---|---|
| Regular Bullish Divergence | Is plotted on bars where a Regular Bullish Divergence is detected. Up arrow by default. |
| Hidden Bullish Divergence | Is plotted on bars where a Hidden Bullish Divergence is detected. Up arrow by default. |
| Regular Bearish Divergence | Is plotted on bars where a Regular Bearish Divergence is detected. Down arrow by default. |
| Hidden Bearish Divergence | Is plotted on bars where a Hidden Bearish Divergence is detected. Down arrow by default. |
Performance and Tuning
To deal with long load times and sluggishness
- Reduce the number of days loaded
- Turn the drawings off
Setting up Alerts
Using the SC built-in alerts, add the alert condition below to the study Alerts Tab
Alert condition: or(SG1<>0, SG2<>0)
| Widget Connector | ||
|---|---|---|
|
More
Widget Connector


