C1 Analyze Pro
C1 Analyzer Pro - developed by trade29 software, powered by Autochartist
For any questions, email support@trade29.com
Quick Start
- If you have not done so already, register and get access to the software
- Open an intraday chart for one of the supported markets (ES/NQ are just two of the common ones to start. See full list at the bottom of this document)
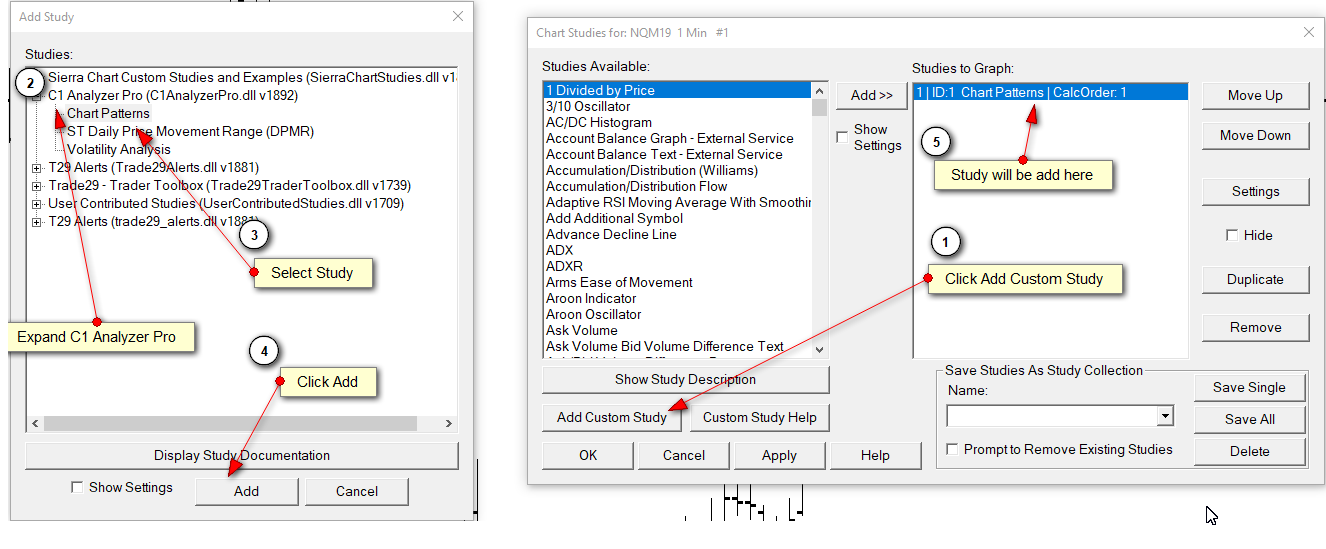
- In Sierra Chart, navigate to “Analysis->Add Custom Study”
- Expand “C1 AnalyzerPro” and add the “Chart Patterns / Key Levels” study to the chart
- Click Ok - if all went well, you should see the Chart Control window with some patterns
- Enable patterns to view them on the chart
If all went well, you should see something like this
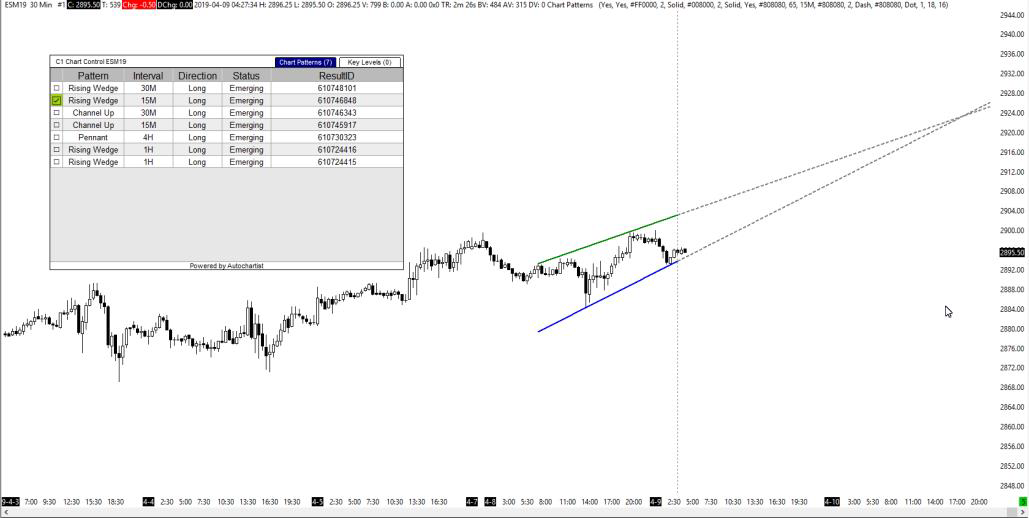
C1 Chart Control Study
The Chart Control window shows the currently available Chart Patterns and Key Levels
Right clicking the chart provides few menu options:
- C1 Chart Control Show/Hide
- C1 Chart Control Attach/Detach
- C1 Dashboard Show
Key Levels Study
Key levels are support and resistance levels detected on various timeframes.
- Access to Key Levels is via the “Chart Patterns + Key Levels” study.
- Available levels can be found under the Key Levels tab on the “C1 Chart Control” window
- Key Levels are detected on 6 possible timeframes: 15M, 30M, 60M, 1H, 4H and Daily
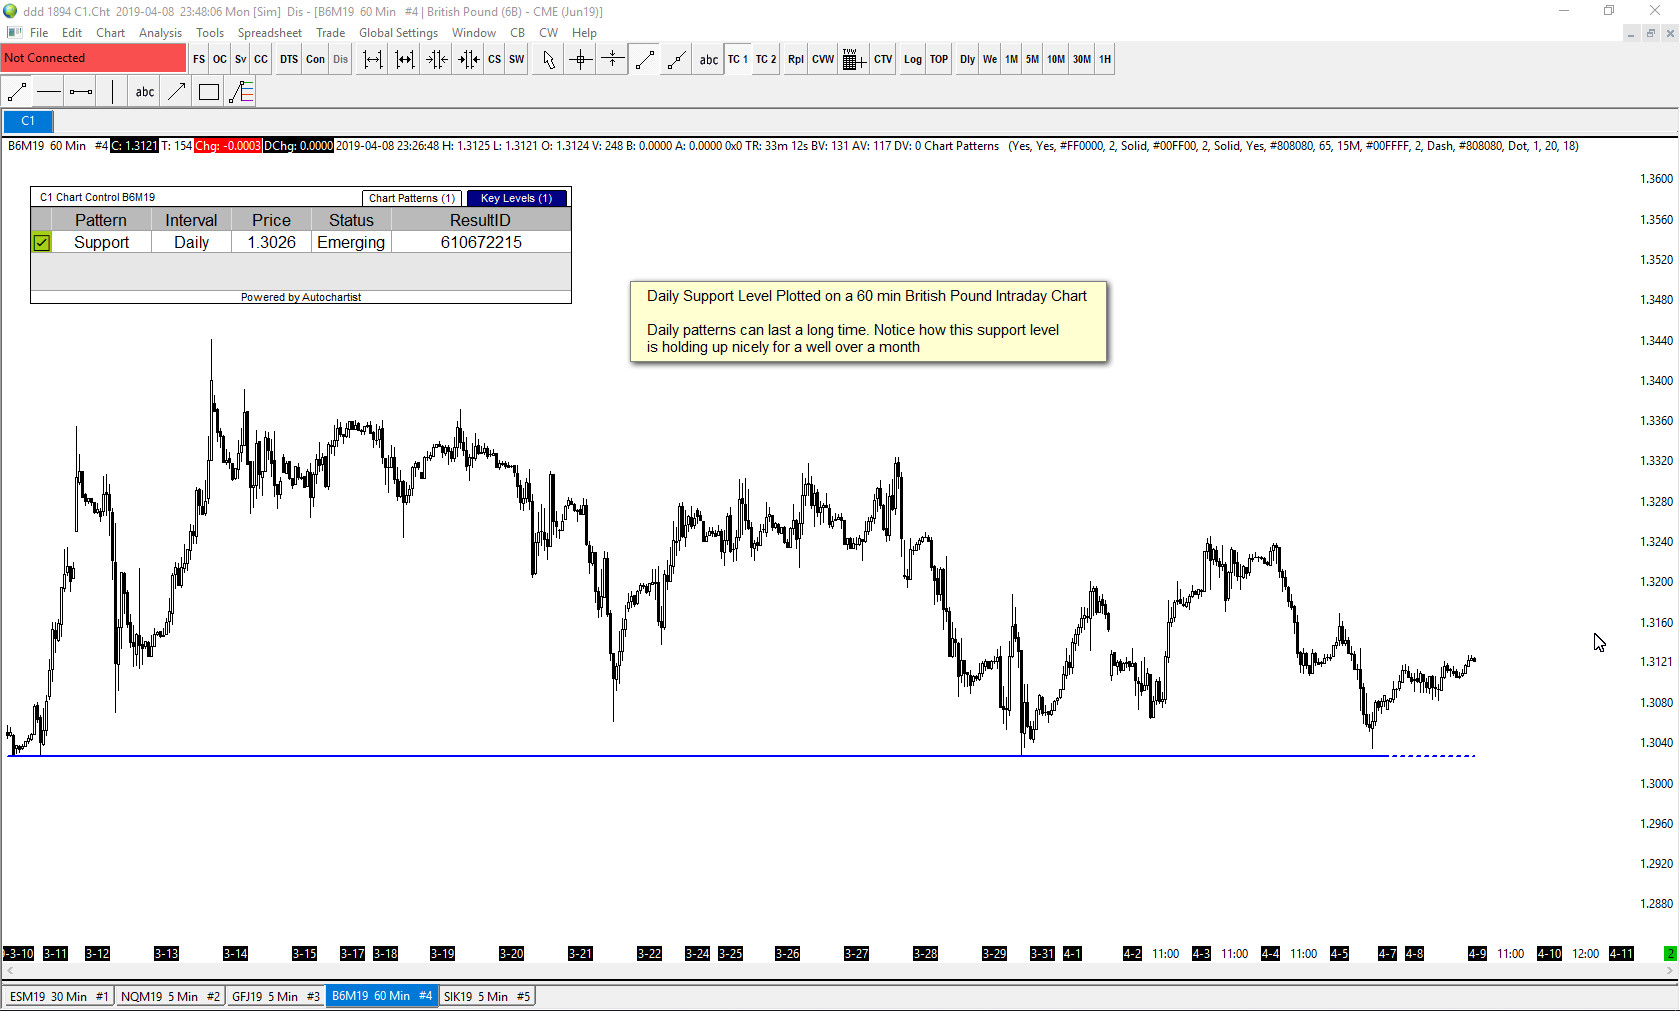
Chart Patterns
Supported Patterns
C1 AnalyzerPro supports 16 of the most common reversal and continuation price patterns. See appendix at the bottom with the full list.
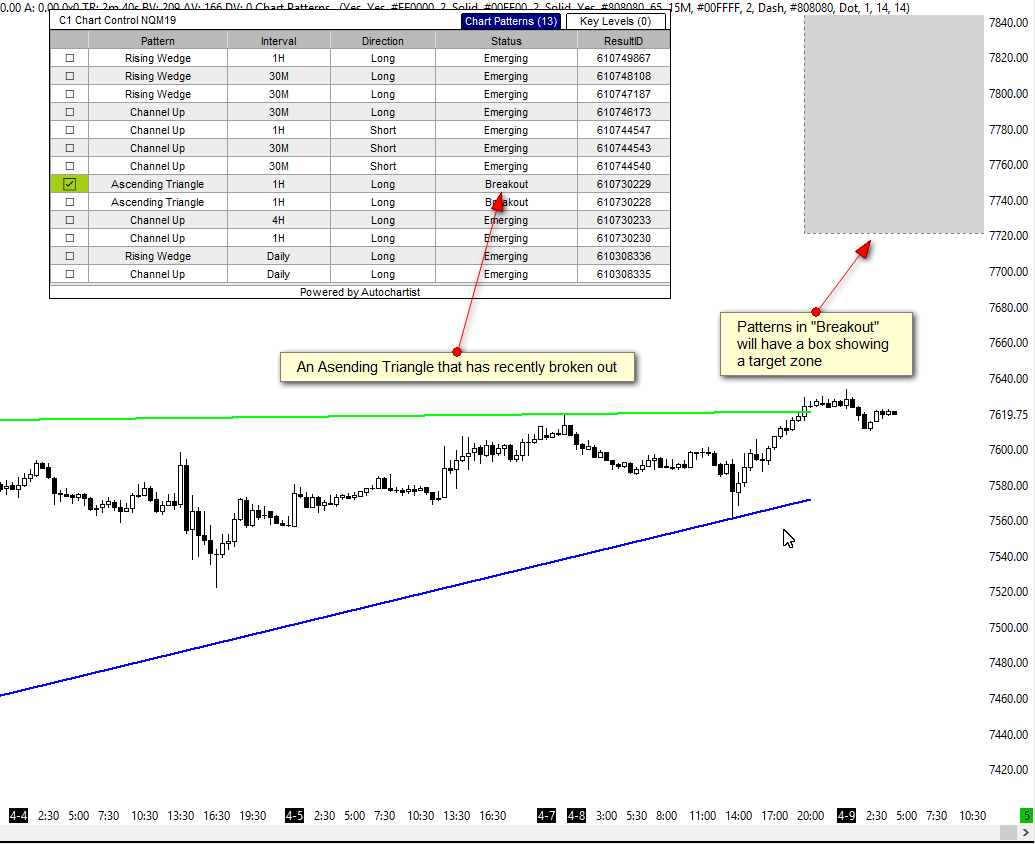
Pattern Status - Emerging vs. Breakout
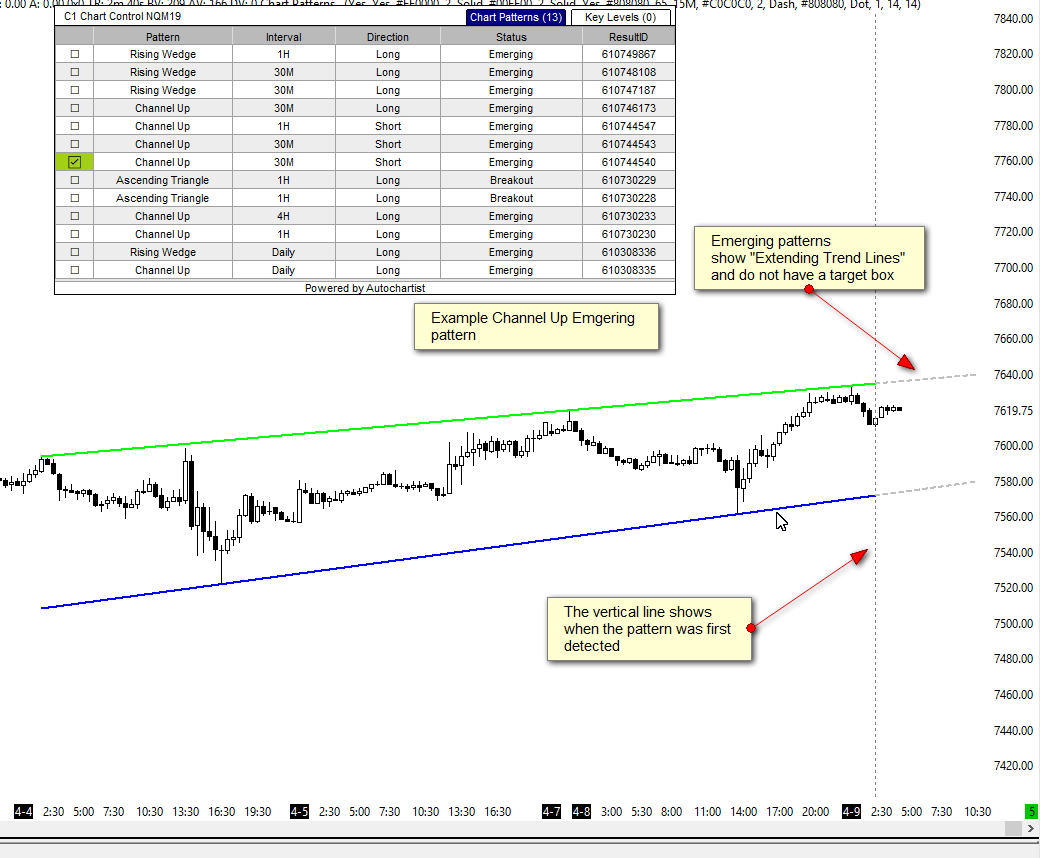
Price patterns go through an evolution. When detected they appear as “Emerging” in the Chart Control.
Once price breaks through a support/resistance line, its Status will change to “Breakout”. When this happens, you will see a target box for the breakout.
Breakout Pattern Example
Emerging Pattern Example
Volatility Analysis Study
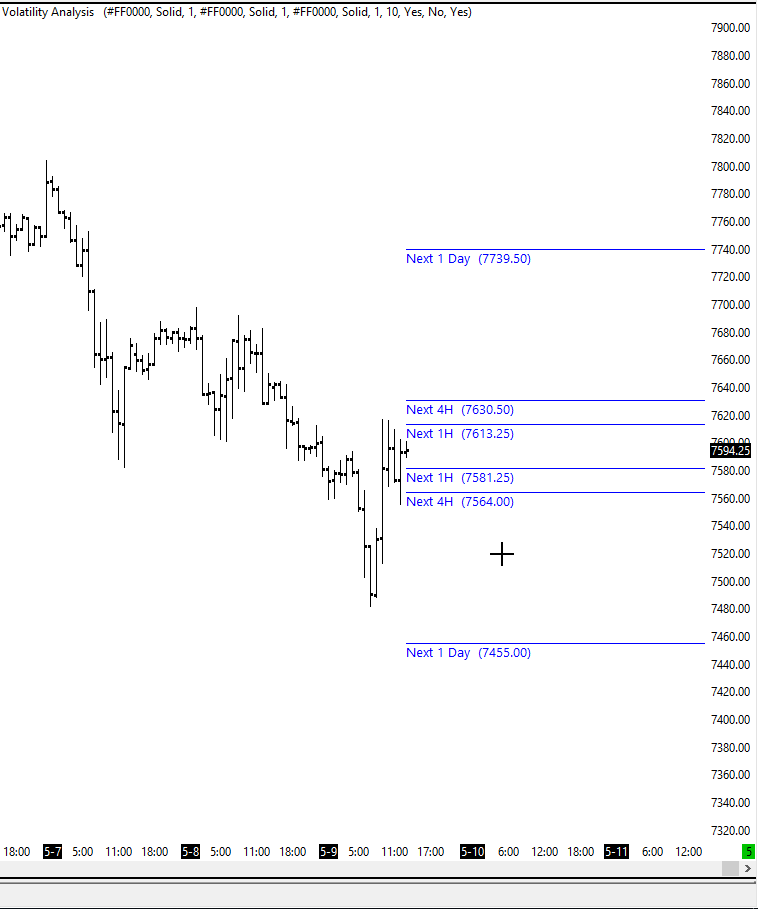
The “Volatility Analysis” study shows where price might be within 1 hour, 4 hours and a single day.
Use these values to set reasonable expectation on where price might get to within a set time. These values are calculated using historic volatiltiy.
The targets on the chart are updated in real time and are relative to the Last price.
C1 Dashboard
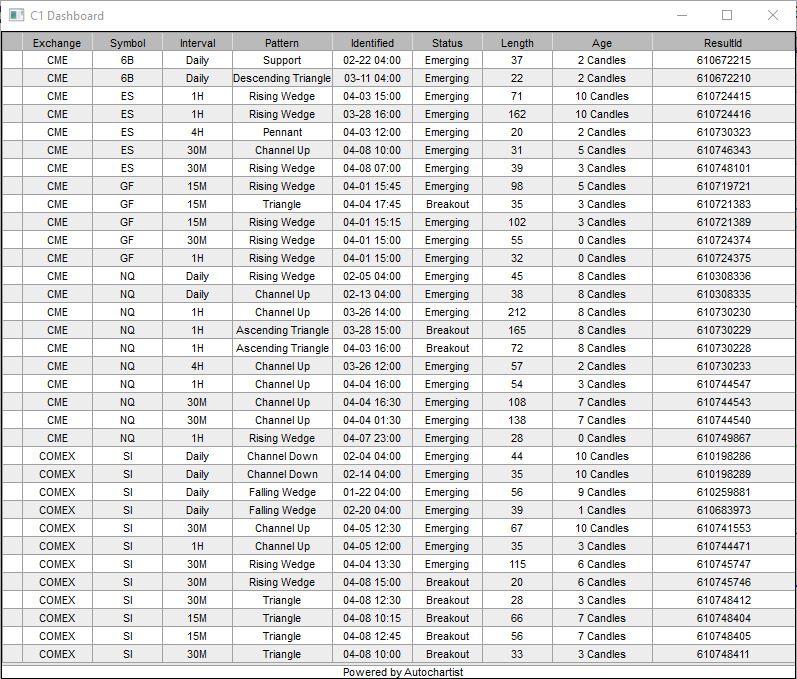
Use the dashboard to quickly find available patterns.
When you add one of C1 studies to a chart, that market will appear in the C1 Dashboard.
The Dashboard can be accessed by right clicking any of the charts that have a C1 study on it.
The Dashboard shows all relevant and active chart patterns / key levels across all markets that C1 is applied to.
Dashboard is sorted by symbol and then by Interval.
Example C1 Dashboard showing 5 markets.
Timeframes and Intervals
The chart patterns and key levels are provided by Autochartist within 6 possible intervals: 15M, 30M, 1H, 4H and Daily.
It is not required to plot a pattern on its interval. for example, it is perfectly ok to plot a 1H pattern on a 5 min chart. In general users can plot the pattern on any chart type and timeframe such as range bars, renko, tick, volume, etc.
Appendix 1 - Supported Markets
Symbol | Description | Exchange |
6C | Canadian Dollar | CME |
ZN | 10 Year US Treasury Note | CBOT |
NG | Natural Gas | CME |
LE | Live Cattle | CME |
ZW | Wheat | CBOT |
CL | Light Sweet Crude Oil | NYMEX |
6J | Japanese Yen | CME |
NQ | E-mini Nasdaq-100 | CME |
ZL | Soybean Oil | CBOT |
ZM | Soybean Meal | CBOT |
HE | Lean Hogs | CME |
ZB | US Treasury Bond | CBOT |
KE | KC HRW Wheat | CBOT |
GC | Gold | COMEX |
ES | E-mini S&P 500 | CME |
RTY | E-mini Russell 2000 | CME |
ZC | Corn | CBOT |
GF | Feeder Cattle | CME |
6S | Swiss Franc | CME |
6A | Australian Dollar | CME |
HO | New York Harbor ULSD | NYMEX |
6E | Euro FX | CME |
QHG | Copper | NYMEX-GBX |
SI | Silver | COMEX |
ZS | Soybeans | CBOT |
6B | British Pound | CME |
YM | E-mini Dow | CBOT |
RB | Rbob Gasoline | NYMEX |
QBZ | Brent Crude Oil | NYMEX-GBX |
Appendix 2 - Patterns
Triangle |
|
Rising Wedge |
|
Falling Wedge |
|
Channel Up |
|
Channel Down |
|
Ascending Triangle |
|
Descending Triangle |
|
Double Top |
|
Double Bottom |
|
Triple Top |
|
Triple Bottom |
|
Rectangle |
|
Flag |
|
Pennant |
|
Head and Shoulders |
|
Inverse Head and Shoulders |
|