Overview
Inspiration for this study is from FT71. He does an excellent video describing what Harmonic Rotations (HR) are, how they are calculated and how to interpret them. The video is well worth the watch and the following will make much more sense once you have seen it.
See here: https://vimeo.com/145456969
The study uses zigzags to find all the rotations on the chart. Study will plot the zigzag lines on the chart and calculate some statistics based on the leg sizes
The HR tools for SC include two studies:
- HR Market Analyze Tool - use this study to calculate rotations for a given market
- HR Trade Assistant - use this study while trading to view projected rotations levels
Inputs
| Setting | Default | Notes |
|---|---|---|
| ZigZag Input Data for High | High | |
| ZigZag Input Data for Low | Low | |
| ZigZag Reversal Amount Units | Points | User can define the reversal amount as ticks or points |
| ZigZag Reversal Amount | 1 | A market must make a retracement greater than 1 point in order for the previous leg to get set in place and a new leg to form |
| Start Time | 00:00:00 | |
| End Time | 00:00:00 | |
| CSV Export File Name | harmonic_rotation_zz.csv | File is saved to SC data folder |
| Text Color | Magenta | |
| Text Size | 11 |
- ZZ modes - in SC, ZZ has 3 modes. We will be supporting mode 2 which uses the reversal amount and number of bars required. See here: https://www.sierrachart.com/index.php?page=doc/StudiesReference.php&ID=133&Name=Zig_Zag#ZigzagCalculationMode2
- Start Time / End Time - filter for rotations between a set time. For example, settings to 9:30:00-16:00:00 would include rotations within this time window and discard all others. A zigzag leg must start and end within this time window to be considered
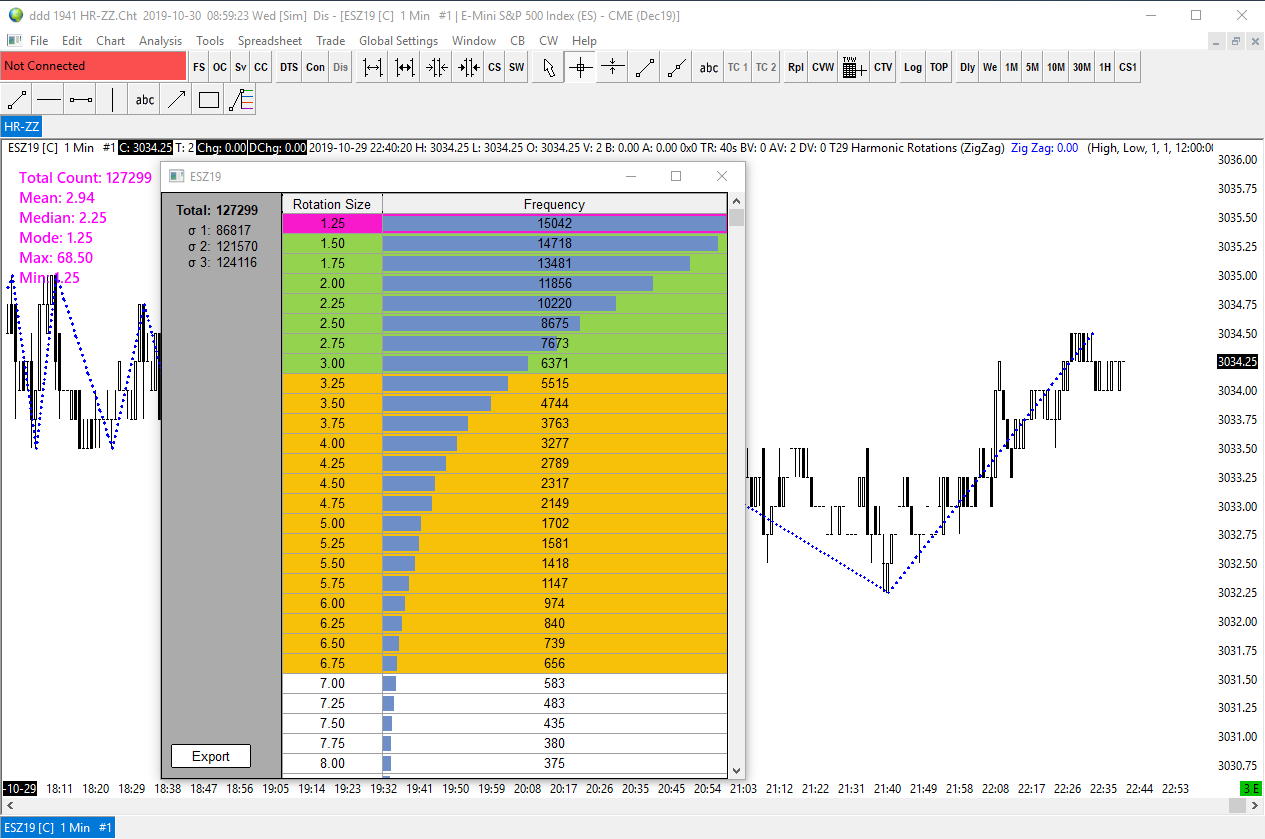
Basic Stats
The stats below are created using all the zigzag legs on the chart (filtered by time).
- Total Count
- Mean - the average rotation size
- Median - the mid size rotation, where 50% of the rotations are greater, 50% are smaller - good for looking at data with outliers
- Mode - the more common rotation size
- Max
- Min
We plot the above in the upper left hand side of the chart values
Frequency Distribution
Study will create a frequency distribution of the leg sizes
In other words, the study will create a table that that has two columns:
- Leg size (in ticks/points)
- The number of legs for each size
Distribution can be exported as csv file (see below).
Right Click Menu Options
Right clicking the chart opens a menu where the study adds options.
Right Click "Show Frequency Distribution"
Menu name "Harmonic Rotation ZZ Show Histogram"
Right Click "Export"
Menu name "Harmonic Rotation ZZ Export"
Writes the frequency distribution table to csv file