...
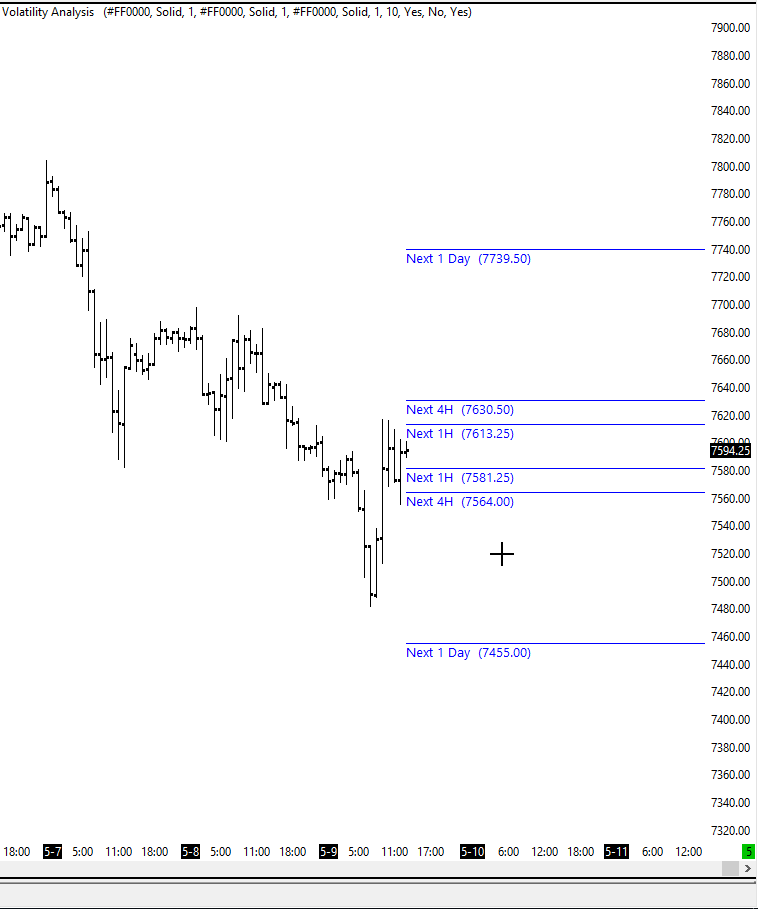
The “Volatility Analysis” study shows where price might be within 1 hour, 4 hours and a single day.
Use these values to set reasonable expectation on where price might get to within a set time. These values are calculated using historic volatiltiy.
The targets on the chart are updated in real time and are relative to the Last price.
C1 Dashboard
Example C1 Dashboard showing 5 markets.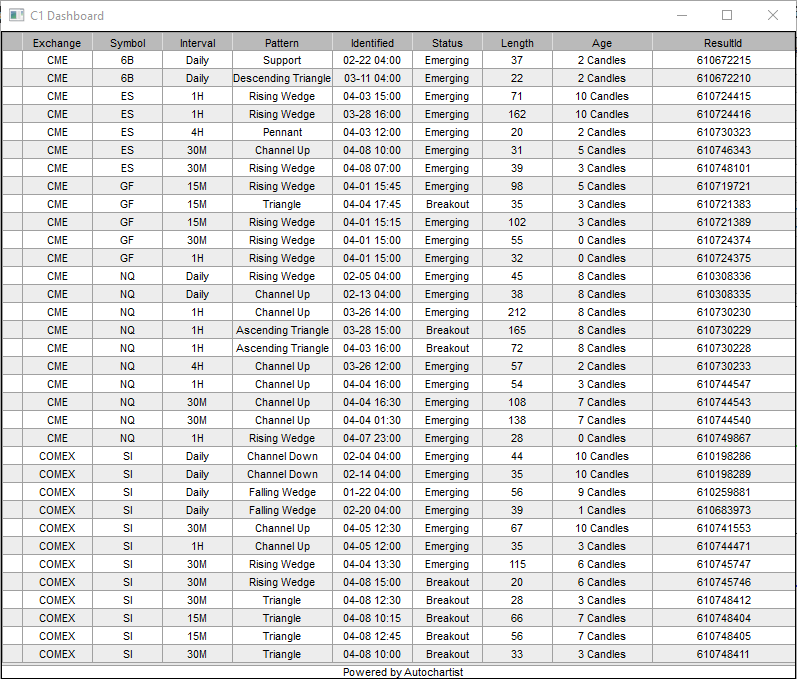 Use the dashboard to quickly find available patterns.
| Widget Connector | ||
|---|---|---|
|
When you add one of C1 studies to a chart, that market will appear in the C1 Dashboard.
The Dashboard can be accessed by right clicking any of the charts that have a C1 study on it.
The Dashboard shows all relevant and active chart patterns / key levels across all markets that C1 is applied to.
Dashboard is sorted by symbol and then by Interval.
Example C1 Dashboard showing 5 markets.
Timeframes and Intervals
...