Overview
- Onn BenZvi
Send data from Sierra Chart to Excel
Solution has two components
- SC Custom study
- Excel AddIn
Data is sent in real time
Main Features
- Time and Sales
- Market Depth
- Chart base data - OHLC, Volume, Trades, Bid Volume, Ask Volume, number of trades, etc.
- Chart subgraph data
Requirements
- Excel 365 64 bit
- The AddIn makes use of some excel features that are currently only available in Excel 365
- Excel generally comes in 32 and 64 bit editions. Most people will be on 64. For the AddIn, you must be on 64 bit, 32 bit is not supported
- Sierra Chart version 2299 or higher
Software Download
The solution includes two components:
- A Sierra Chart custom study dll which you add to the chart
- An Excel AddIn file which is installed in Excel
Download links
- SC Custom Study - T29-SCExcel_64.dll
- Excel AddIn - T29-SC-Cht-ExcelAddIn64-packed.xll
More details
Quick Start
If you have not done so, first download and install the software (see the previous section).
Lets start with the SC side
- Start SierraChart and open a chart
- Add the SC-Excel custom study to the chart
- Set the key in the study settings. For the example below, set the key as "xx"
Next in Excel
- Open a new blank workbook
- In any cell, type =sc.cht.GetOHLC("xx", 0,5,TRUE)
The above command will post OHLC values for the most recent 5 bars on the chart with key "xx"
If all goes well, at this point you should see the 5 rows of data like in the image below.
Excel User Functions
- sc.cht.GetSGData(key, study_id, sg_number, bars_back, number_of_rows, include_bar_timestamp)
- sc.cht.GetSGData2(key, data, include_bar_timestamp)
- sc.cht.GetOHLC(key, bars_back, number_of_rows, include_bar_timestamp)
- sc.cht.GetOHLCV(key, bars_back, number_of_rows, include_bar_timestamp)
- sc.cht.TimeAndSales(key, number_of_rows)
- sc.cht.MarketDepth_MBO(key, number_of_rows)
- sc.cht.MarketDepth(key, number_of_rows, plot_mode)
- sc.cht.Debug()
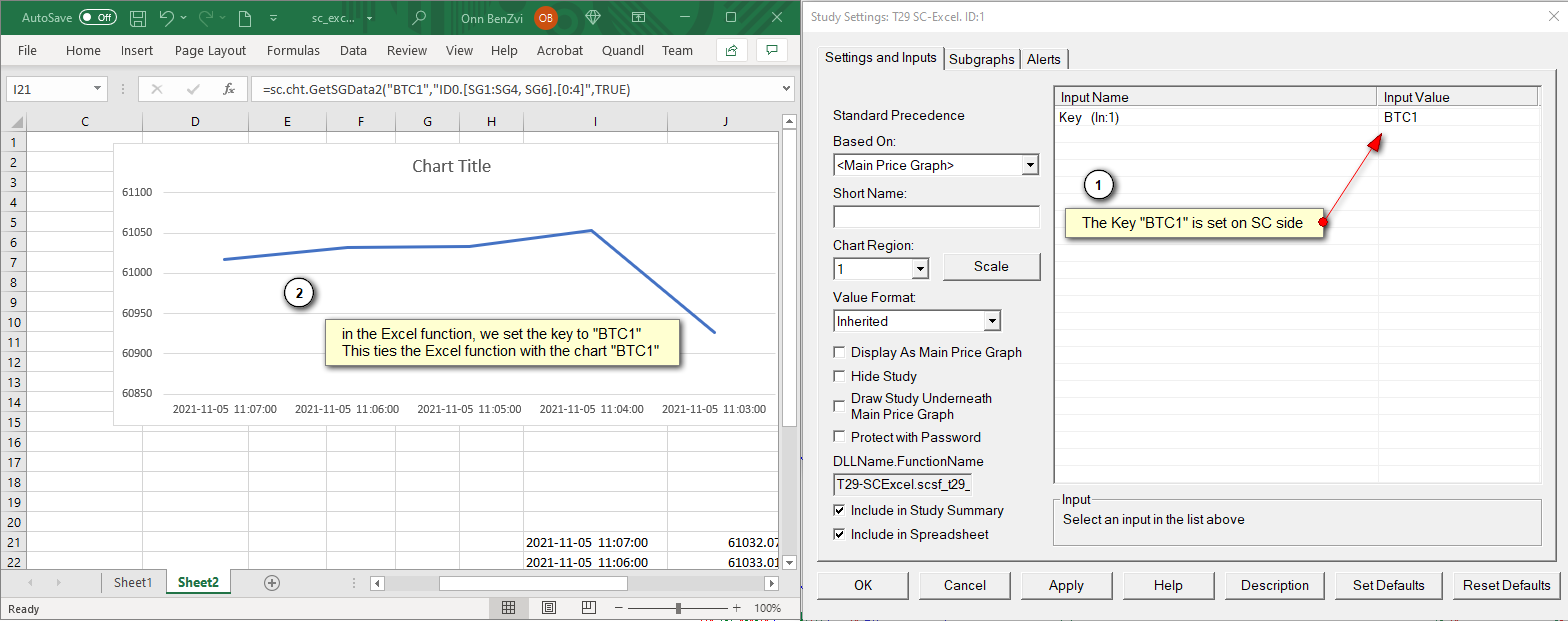
The "key" Parameter
You will notice that the "key" parameter is the first parameter in each of the cht functions.
On the SC side, each chart you wish to access needs to have the "T29 SC-Excel" study added to it. In the study settings is a field called "Key". You can set this "key" to anything that makes sense. The only requirement is that it is unique and you don't use the same "key" on two different charts.
The "key" parameter ties the excel function with a specific chart.
Case does matter - if you set a key "XYZ" (upper case) in Sierra Chart, the key in Excel must also be "XYZ" ("xyz" lower case won't work).
sc.cht.GetSGData2
=sc.cht.GetSGData2(key, data, include_timestamp)
- key
- data - the study id, sg's and row to subscribe to. See format below)
- include_timestamp - whether to include a timestamp column nor not
The "data" parameter format
The second parameter to the function, "data" generally has the following format: study_id.[sg_number].[rows]
A simple example of this is something like sc.cht.GetSGData2("BTC1", "ID0.[SG1].[0:5]", TRUE)
In this example, data is set to ID0 (the main price graph) and retrieves the most recent 6 bars from SG1 (which happens to be the Open).
In more detail
study_id - formatted like it appears in SC. ID1, ID2, ID3 etc. ID0 is the main price graph.
sg_number - subgraphs are denoted similar to SC. SG1, SG2. SG3 etc. The field supports single values, range and list
Single - [SG3]
Range - [SG3:SG5]
List - [SG3, SG4, SG5]
Mixed list and range [SG3:SG5, SG8, SG9]
rows - a single value or range of rows. the first row is the live bar and is numbered 0
Single: [0] - just the live bar
Single: [5] - just the 5th bar
Range: [0:5] - rows 0-5, total of 6 rows
Examples
Main price graph, Open, rows 0-5
=sc.cht.GetSGData2("BTC1", "ID0.[SG1].[0:5]", TRUE)
Main price graph, OHLC + Volume, rows 0-5
=sc.cht.GetSGData2("BTC1", "ID1.[SG1:SG5].[0:5]", TRUE)
Study with ID1, subgraphs 1-5, 7 and 8, rows 1-20
=sc.cht.GetSGData2("BTC1", "ID1.[SG1:SG5, SG7, SG8].[1:20]", TRUE)
Videos
- Market depth - https://youtu.be/CWPuFFjJZsY
- Market depth with MBO - https://youtu.be/OuqYRwnoSC0
sc.cht.TimeAndSales
Filtering records
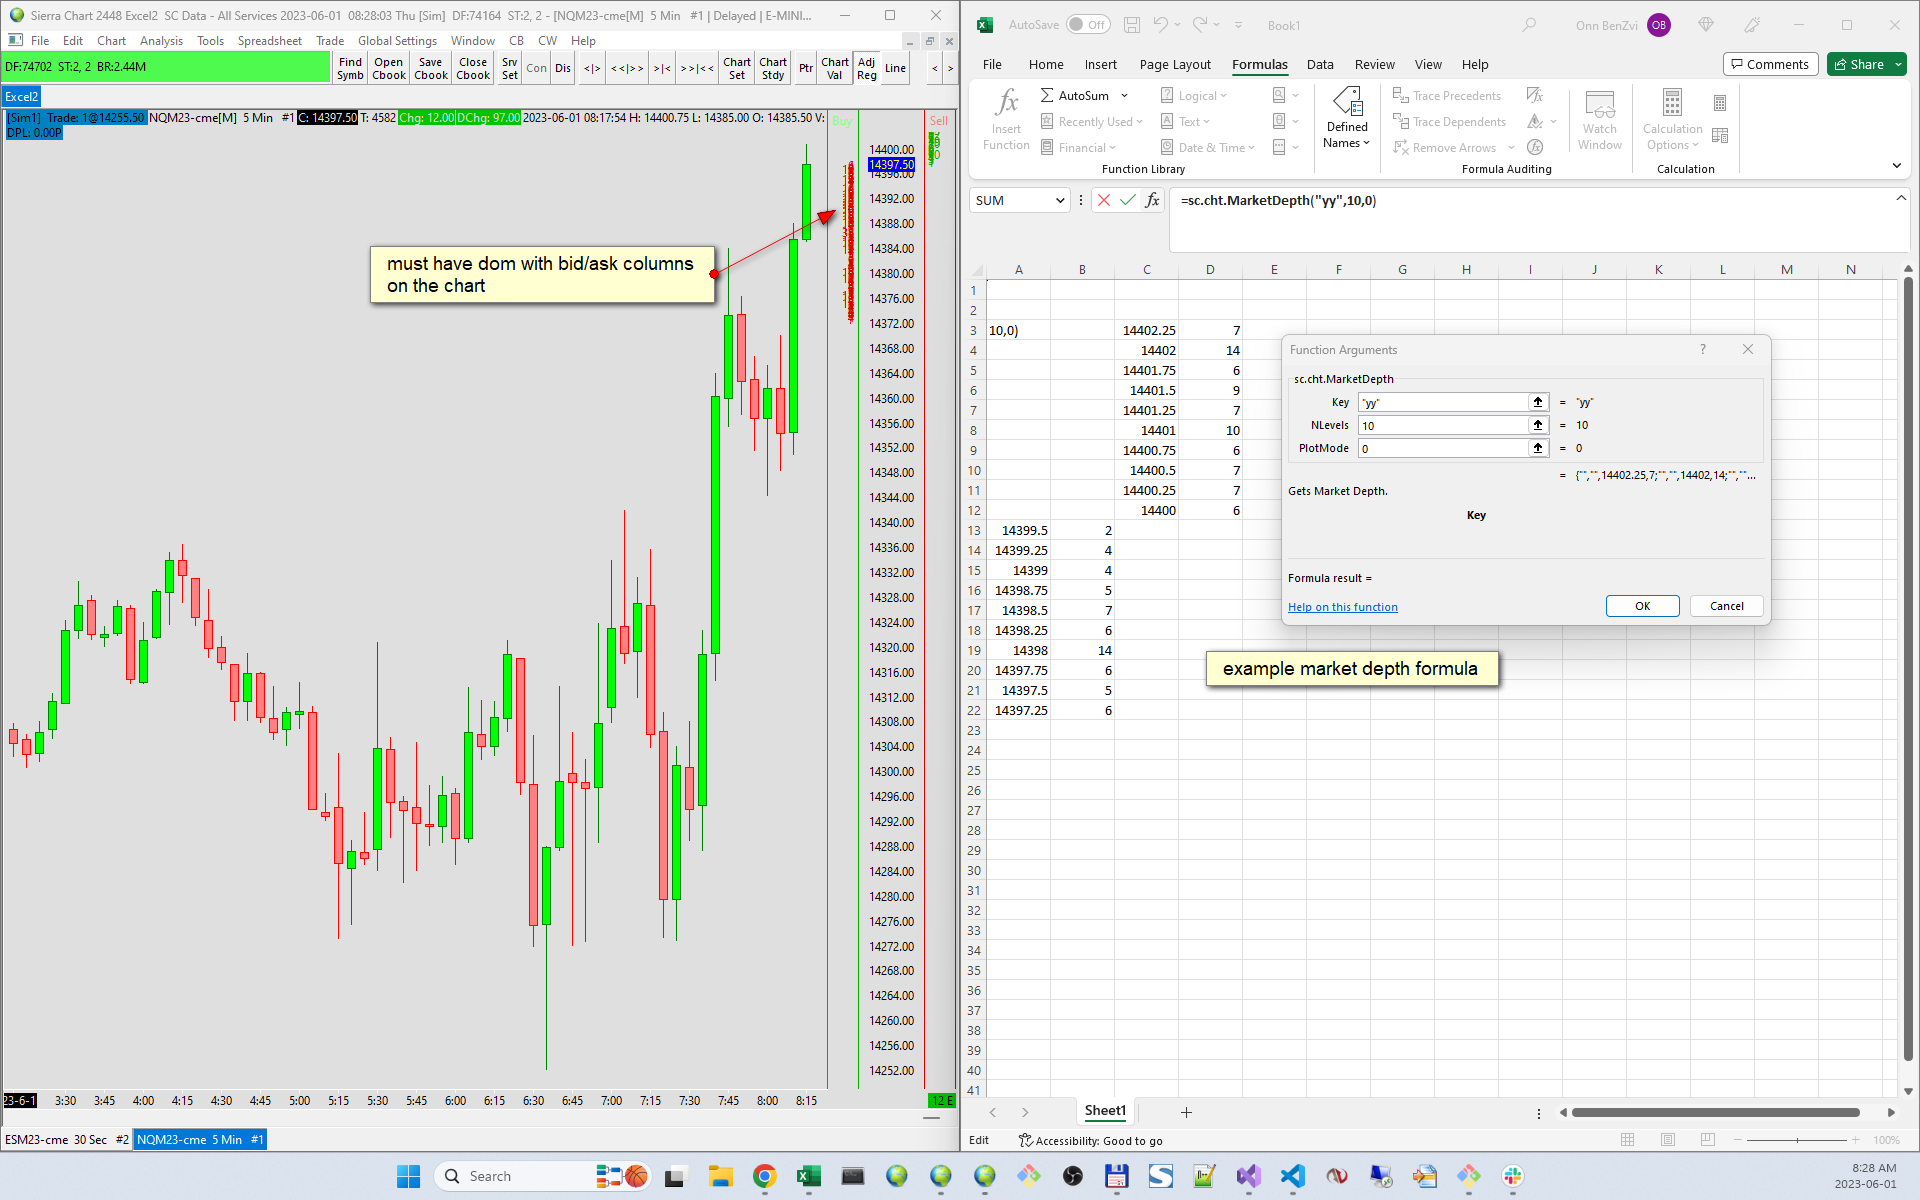
sc.cht.MarketDepth
SC Dom must be added to the chart with bid/ask columns
- Market depth - https://youtu.be/CWPuFFjJZsY
sc.cht.MarketDepth_MBO
Sierra Chart Server Settings → Subscribe Market By Order Data When Market Depth Subscribe = Yes
Market depth - https://youtu.be/CWPuFFjJZsY
Market depth with MBO - https://youtu.be/OuqYRwnoSC0
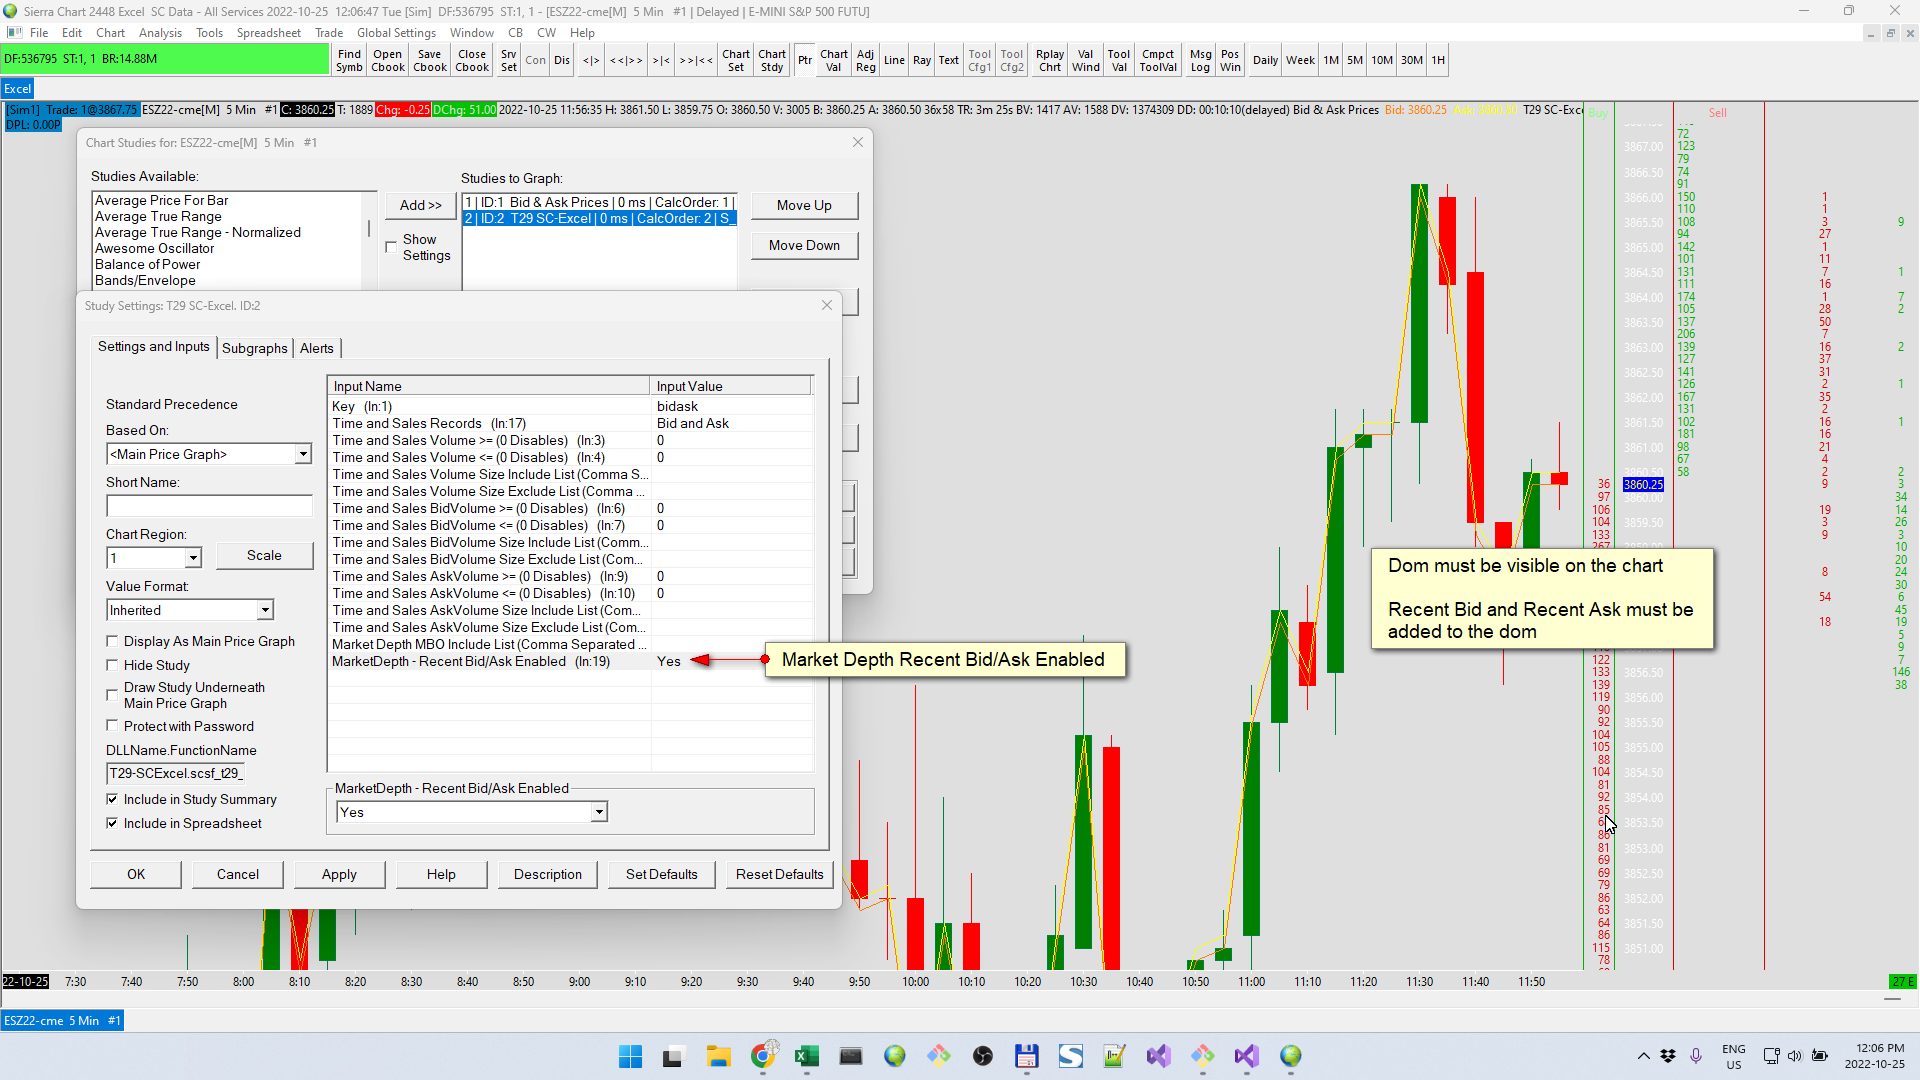
Market Depth Recent Bid and Recent Ask
Sierra Chart supports Recent Bid and Recent Ask columns in the market depth - see here for more details - https://www.sierrachart.com/index.php?page=doc/GlobalTradeSettings.html#ColumnDescription_RecentBidVolume
See video -
This data is available the sc.cht.MarketDepth and sc.cht.MarketDepth_MBO excel functions.
To configure:
- In SC, add the dom to the chart, add the recent bid and recent ask columns - you must have the recent bid and recent ask columns on the chart
- Still in SC, In the SC-Excel study settings, set Market Depth Recent Bid/Ask Enabled to "yes"
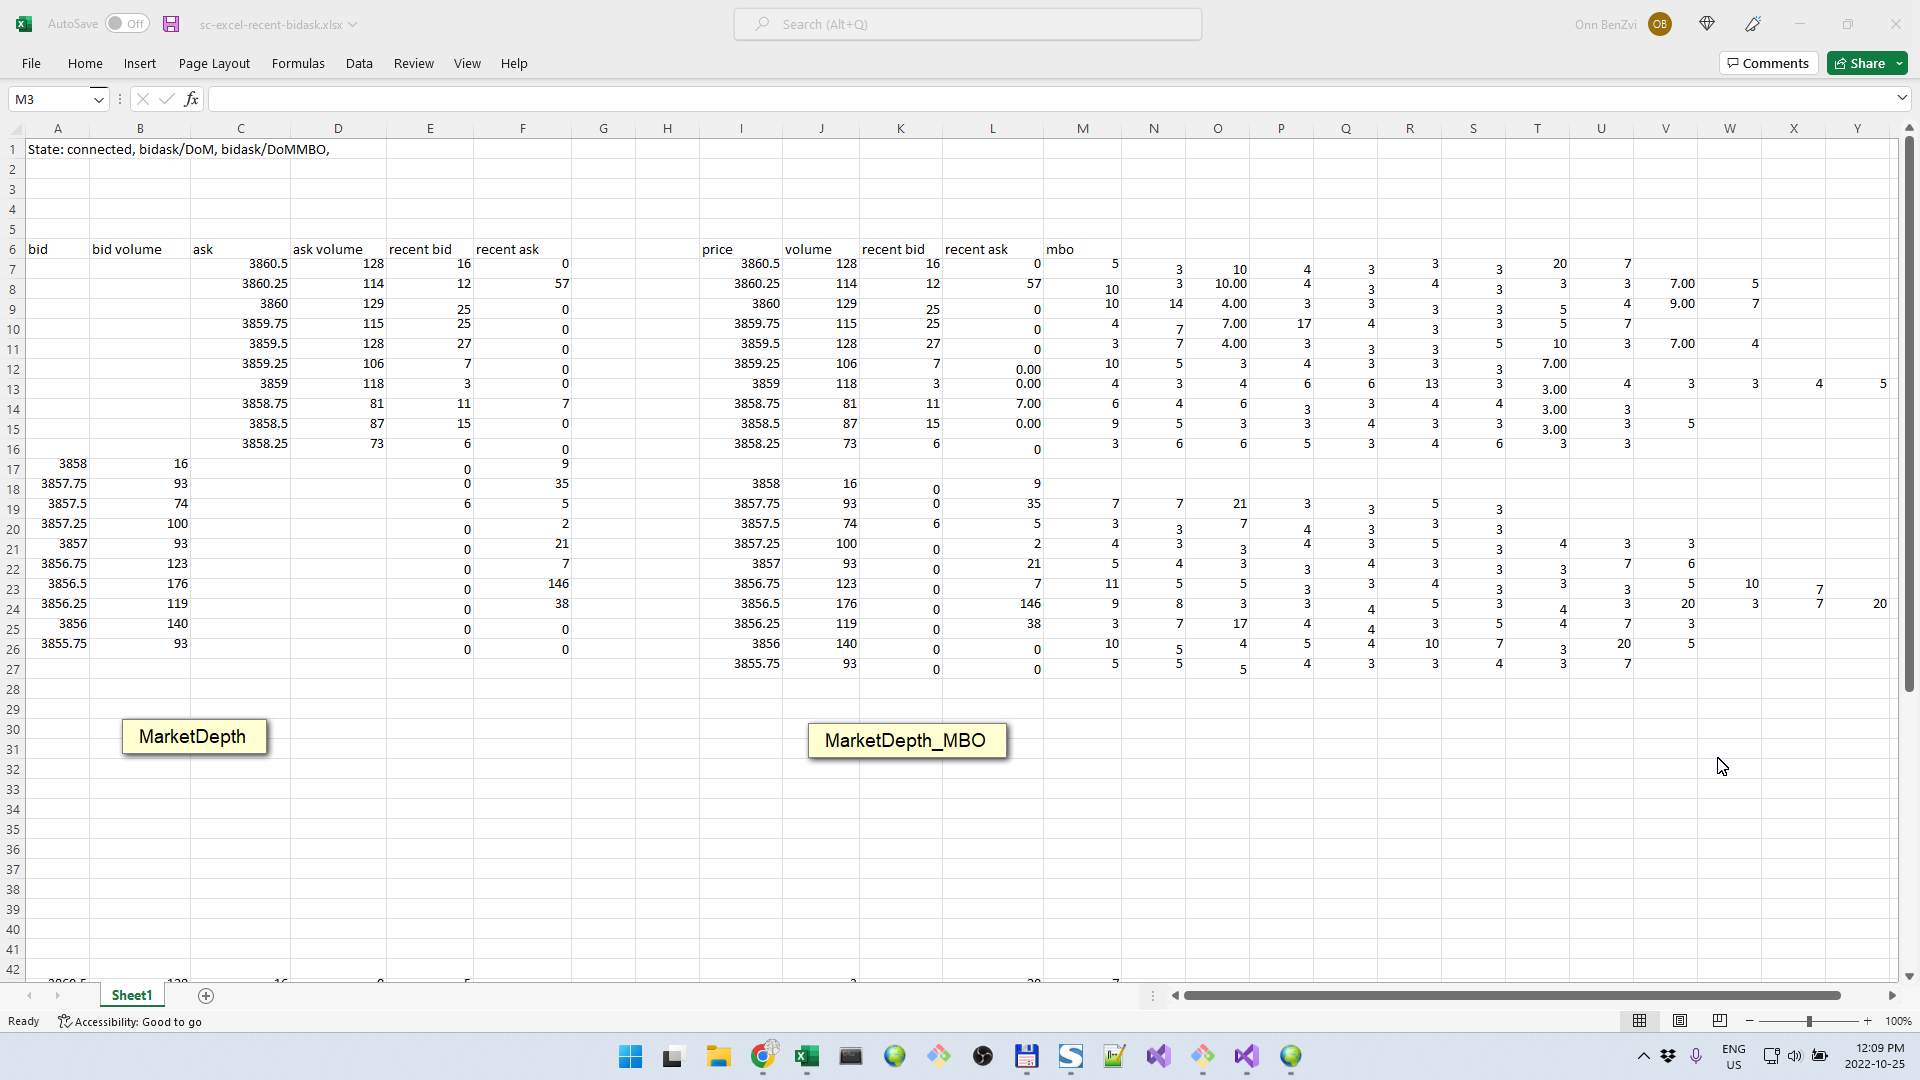
- In Excel, add the sc.cht.MarketDepth or sc.cht.MarketDepth_MBO to your sheet and set the params
If all goes well, you should see market depth with recent bid ask columns
FAQ's
Can I do anything to speed the refresh rate up?
Yes, settings can be changed on both sides Sierra Chart and Excel
Sierra Chart will periodically send data to Excel - how often this happens is controlled by the "Chart Update Interval".
As it receives data, Excel will periodically update the cells - how often this happens is controlled by the RTD throttle - see here for more Setting the RTD Throttle
What's the difference between GetSGData and GetSGData2? - which one should I use?
They both have the same purpose - receiving subgraph data from the chart. Originally we created GetSGData. After working with it a while we saw the need to add GetSGData2.
Using GetSGData you can grab data for a single subgraph. It has a very straight forward interface but it's limited to a single subgraph. If for example you had some study X that had 5 subgraphs in it and you wanted to grab all 5, you would need to add GetSGData 5 times to the spreadsheet which is fine but a bit tedious.
On the other hand GertSGData2 has a more complex syntax but it allows you to subscribe to those 5 subgraphs in one call.