T29 Divergence Study
- Onn BenZvi
Overview
(click on image to enlarge)
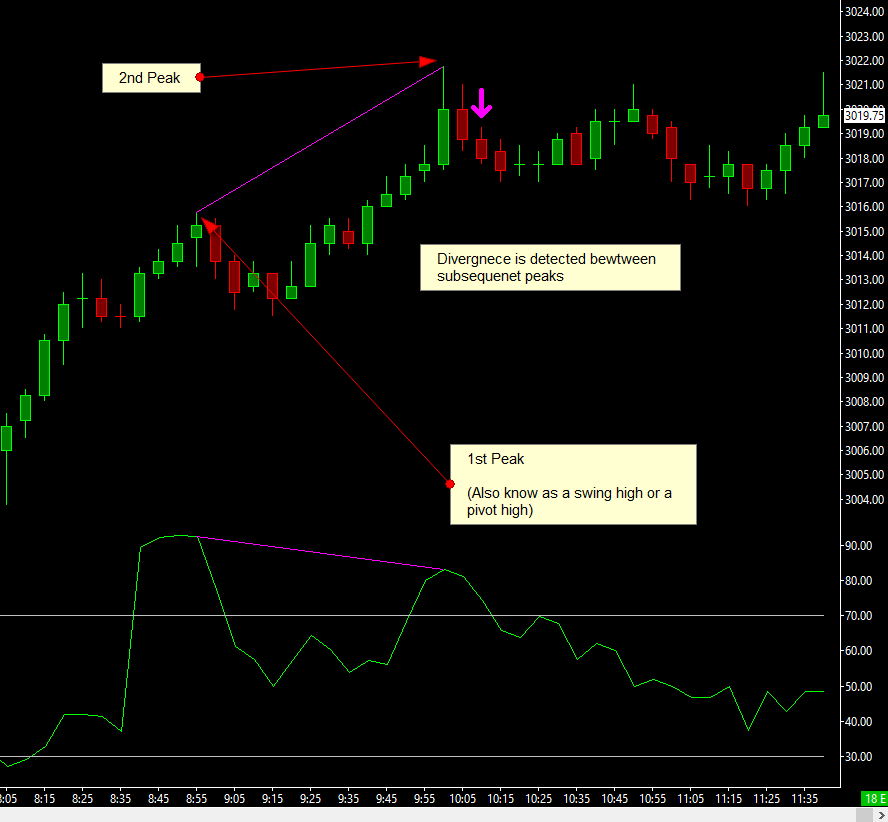
The study works by detecting divergence between subsequent peaks on the chart. Peaks in this context is the synonymous to swings or pivots.
In the image on the right you will an example.
There are a few points to understand and the rest will be easy.
- The 1st peak refers to the swing that is on the left hand side of the chart
- The 2nd peak refers to the swing that is on the right
- In order for the divergence to be detected, we must have both peaks confirmed. (Important to note that the peak is only confirmed after the fact, In the example on the right, the peak is confirmed 2 bars after it has formed since we have to wait for price to make two lower highs)
- The arrow in the image will appear on the bar where the the 2nd peak was confirmed
- Once we have a confirmed divergence, the study will draw the lines between the two peaks
Swing Sizes and Sensitivity Setting
These swings come in different sizes, the size determines the peak's significance.
A swing high of 20 bars effectively means that at least 20 bars on the left have lower highs and 20 bars on the right have lower highs.
A smaller swing of 3 would mean that 3 bars on the left have lower highs and 3 bars on the right have lower highs. There are obviously many more swings of size 3 on the chart vs. swings of size 20.
In the divergence study, we set the size of the peaks we are after using sensitivities.
Sensitivity settings for the 1st peak and the 2nd peak are separate. This allows to fine tune the chart pattern we are after. It is common to have the 1st peak be a rather large swing where as the 2nd peak is a smaller one. Smaller peaks are detected earlier.
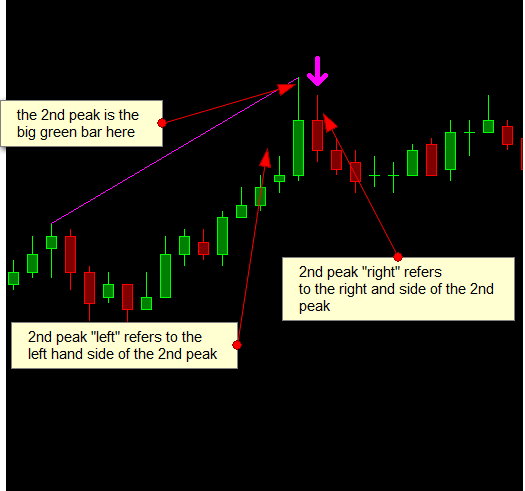
2nd Peak and Early Detection
The 2nd peak actually has 2 sensitivity values: 2nd peak left and 2nd peak right. The reason for that is to allow for a mix of detecting peaks that have advanced enough in one direction but to get an early alert without having to wait for the full pattern to form (see the images below for an example.
Inputs
| Input name | Description |
|---|---|
| Oscillator | Reference to the subgraph we want to detect divergence with |
| Draw Divergence Lines On | Select whether to draw the actual divergence lines on the main price panel and/or the oscillator region |
| Oscillator Graph Region | The graph region of the oscillator |
| Sensitivity 1st Peak | Number of bars sensitivity for the left side swing (see more below) |
| Sensitivity 2nd Peak Left | Number of bars sensitivity on the left hand side of the right peak |
| Sensitivity 2nd Peak Right | Number of bars sensitivity on the right hand side of the right peak |
| On Bar Close | Should the divergence be detected on bar close or intrabar |
| Arrow Offset | Visual offset in ticks of the arrow from the bar |
| Mode | Select between Regular and Hidden Divergence |
Subgraphs
| Subgraph | Description |
|---|---|
| Bullish Divergence Detected | An up arrow by default, below the bar |
| Bearish Divergence Detected | A down arrow by default, above the bar |
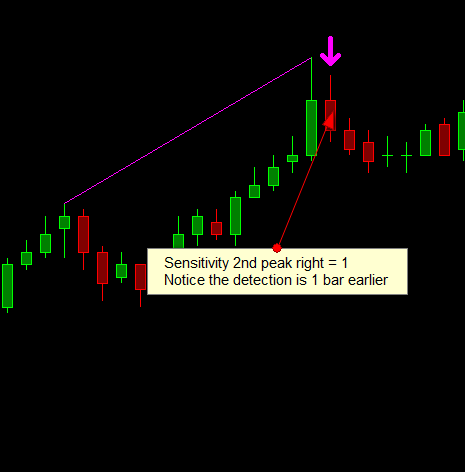
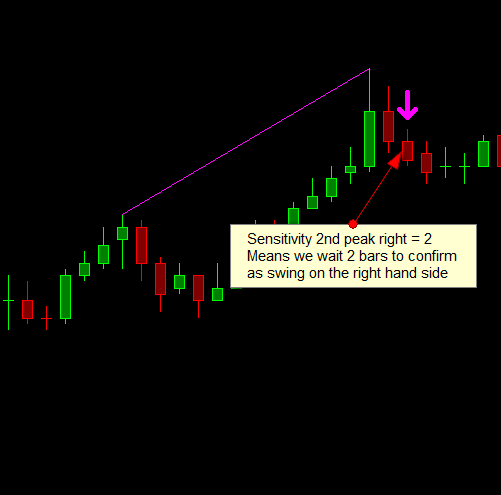
- Note that the detection uses swing points. That means that the right side swing must form in order for the divergence to be drawn. Depending the "Sensitivity 2nd Peak Right" setting, there will be that much delay in detection because we have to wait for the swing to form (Its a classic trade off between waiting for a full price pattern to form vs. earlier detection with patterns that have not fully formed). The arrows will appear on the bar where the divergence was detected. If you look at a historical chart, the arrow shows you when you would have been alerted to the divergence.
Performance and Tuning
To deal with long load times and sluggishness
- Reduce the number of days loaded
- Turn the drawings off
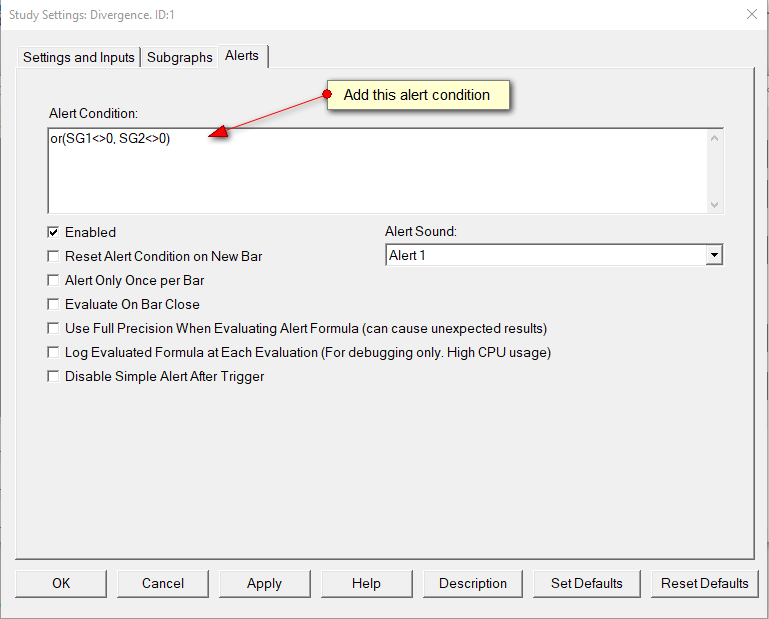
Setting up Alerts
Using the SC built-in alerts, add the alert condition below to the study Alerts Tab
Alert condition: or(SG1<>0, SG2<>0)
More